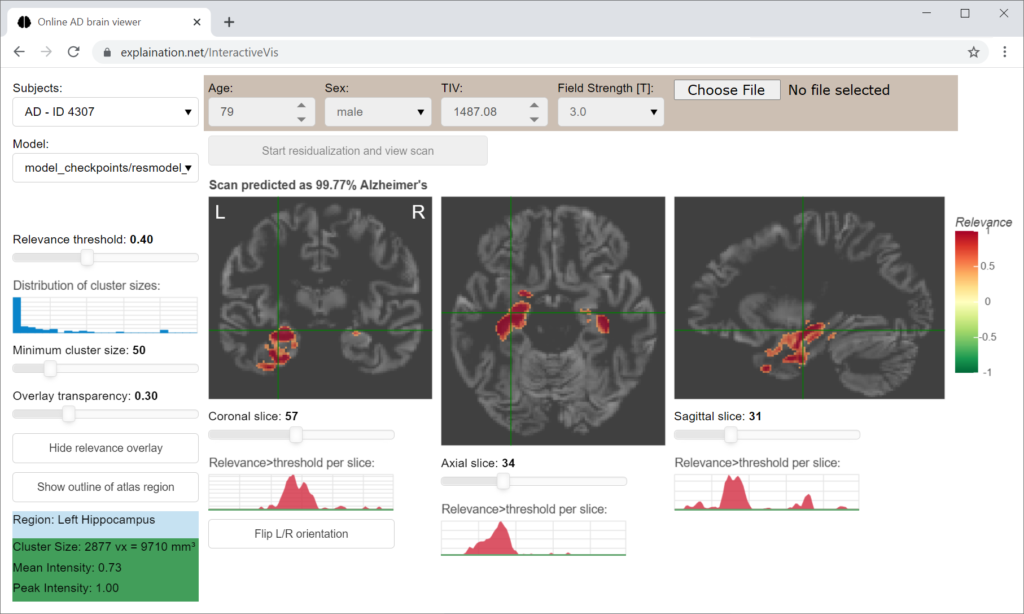
The interactive relevance map visualization application displays brain areas that contribute to the model’s decision.
For the task to dectect Alzheimer’s disease, high relevance (shown in red) corresponds to disease-specific gray matter volume reduction (atrophy).
Disclaimer: This app is not intended to be used for clinical use and decision making. Although the models achieve a high average accuracy, they are still subject of research. This app is provided for illustration purpose only.
How to use it
You can select different MRI scans in the top left selection box or upload your own scan (see instructions below). The scan is then analyzed by the convolutional neural network to obtain the diagnostic class (Alzheimer’s or normal) and relevance map.
In the main window, the relevance maps are then displayed for each slice. You can navigate through the slices by just clicking on the desired spot to center, scrolling, or by using the sliders below the slices.
The demo includes a sample of 15 subjects per group, which were arbitrarily selected from ADNI2 based on the following criteria:
- Subject ID (RID) ≥ 4000
- Age ≥ 65 years
- Amyloid-beta status positive for Alzheimer’s dementia (AD) and amnestic mild cognitive impairment (MCI), negative for cognitively normal controls (CN); based on the AV45-PET information provided by the Jagust lab (threshold >1.11)
- Magnetic field strength = 3 Tesla
To upload your own scan, please preprocess the T1-weighted MRI scan using the CAT12 toolbox for SPM12. We were using the default options and default MNI brain template provided by CAT12. You will need the warped and modulated gray matter segment, that is written out by default (file with mwp1 prefix). Brain surface estimation and ROI analysis can be disabled to save time. CAT12 processing usually takes between 10 and 20 minutes per scan.
In the app, you will need to enter the person’s age, sex, total intracranial volume (provided in the CAT12 segmentation report PDF), and the MRI field strength to correct for these confounding variables.
Data privacy statement: Uploaded data will not be stored permanently. They are deleted when the session/bowser tab is closed.
You can adjust various thresholds, for instance for the relevance level or cluster size. Here, the cluster size refers to the number of adjacent voxels above the threshold forming a contiguous area.
If you lower these values, less relevant image areas or smaller clusters will be displayed, making the relevance map appear noisier.
You can increase the transparency to better see the underlying atrophy patterns.
In the left bottom corner, the anatomical brain region label is displayed for the cluster at the current cross-hair position.
You can also toggle a visual outline of this brain region using the ‘show regions’ button.
In the left sidebar, you can also switch between different convolutional neural network (CNN) models that were obtained from the whole ADNI-GO/2 training sample or via tenfold cross-validation. We preselected the model trained on the whole ADNI-GO/2 dataset.
The accuracy as well as the contributing brain regions vary between the models, as the training subsamples were slightly different and the CNN training contains strong random variation (e.g. due to the dropout layers).
Numbers below were obtained for the independent DELCODE validation sample:
| Fold | Balanced accuracy for MCI vs. CN |
Balanced accuracy for AD vs. CN |
AUC for MCI vs. CN |
AUC for AD vs. CN |
| whole dataset | 71.0% | 85.5% | 0.775 | 0.953 |
| cv1 | 68.6% | 86.9% | 0.747 | 0.946 |
| cv2 | 69.5% | 88.2% | 0.784 | 0.950 |
| cv3 | 69.8% | 81.5% | 0.774 | 0.921 |
| cv4 | 68.6% | 80.6% | 0.757 | 0.928 |
| cv5 | 64.8% | 72.9% | 0.732 | 0.882 |
| cv6 | 69.7% | 84.6% | 0.742 | 0.930 |
| cv7 | 67.7% | 90.8% | 0.754 | 0.957 |
| cv8 | 71.6% | 86.2% | 0.768 | 0.947 |
| cv9 | 73.3% | 88.9% | 0.781 | 0.955 |
| cv10 | 66.4% | 74.6% | 0.772 | 0.956 |
| Mean CV | 69.0% | 83.5% | 0.761 | 0.937 |
Note that the provided model performance is for the independent DELCODE validation sample. The first model was obtained from training on the full ADNI-GO/2 dataset. The cv* models were obtained from cross-validation, i.e. using different 90% partitions of the training data to evaluate the variability.